Throughout my life, I’ve had this recurring experience. I’ll “know” something intellectually, but I won’t really KNOW it. Not in my gut or in my bones. Not in a way that changes how I feel or act.
Or: I’d have a gnawing sense that there was something I was missing. Some sort of information or insight that was accessible to me, but I couldn’t see it. A blind spot that I wasn’t aware of, and couldn’t find, even if I was looking for it.
I knew, for instance, that emotions are fleeting. I’d read the psychology. I understood the concept behind hedonic adaptation, discussed in books like Daniel Gilbert’s Stumbling on Happiness. But I didn’t truly believe it about myself, in my bones, until I used a mood tracking app called Daylio for several months. Seeing the data accumulate - day after day, showing that I bounced back from difficult moments, was a profound experience. It has given me a felt sense of resilience that I didn’t have before.
One thing that was a blind spot, which Daylio helped me to see, is that my baseline mood is actually quite positive. For someone who considered themselves to be something of a curmudgeon, this was a revelation.
The data taught me something new. It also made something I already “knew” feel real.
This gap between intellectual knowledge and embodied understanding is one of the central problems I’ve been circling for years. It’s why I’ve spent the past couple of years building tools that are designed to make the invisible visible for me, and hopefully others. In the case of Snoopy and Flawcastr, it relates to your finances, even though this insight can be extended more broadly.
The things you think you know
Let’s take health as a different example.
I’ve worn an Apple Watch for many years. (I’m on my third one. I’m not kind to them…) What has surprised me about having an Apple Watch isn’t that it influences my behaviour, so much as it validates that I’m actually in pretty good shape.
Contrary to the narrative I would naturally tell myself, I’ve realised that I’m in better shape, and sleep better, than I think I do.
I recently exported over 10 years of Apple HealthKit data and started charting it. Weight. VO2 max. Step counts. Everything. Plotted over time, with the ability to zoom in and out, patterns emerged that I simply hadn’t noticed living through them day by day.
I could see my weight increasing and my VO2 levels (fitness) declining during a particular 18-month period. I already knew that period had been difficult. But seeing it externalised in the data made me realise that this manifested. It also gave me more nuance in understanding that period. Looking at the timing of the data, it became clear that some stressors had a more significant impact on my health than others.
The narrative I’d been living was kind of right. But it was also wrong in several ways. I needed to see it from outside to recognise that. This will inform my behaviours and decisions going forward.
Where does your money actually go?
You know you spend money. You see transactions in your bank account. You have a general sense of your spending patterns. You might even think you know roughly how much you spend on different categories.
But do you really?
This is why I built Snoopy. (In pre-sale as I publish this, available at a discounted price until it public.) Not because people don’t have access to their transaction data. But because having access and actually SEEING it are two different things. A transaction list can be like a forest. You can’t see the patterns because you’re standing among the trees.
Snoopy helps you import your bank transactions and categorise and analyse your spending. I’ve been my own guinea pig for the past couple of years, and even though I consider myself reasonably financially aware, I was genuinely surprised by what I found.
I wasn’t shocked by any one transaction. But seeing the accumulation over months and years? Seeing it categorised and visualised? It revealed patterns I simply hadn’t noticed.
I thought I knew roughly how much I spent on certain categories. I was off by quite a lot in some cases. I thought my spending was reasonably consistent month-to-month. It wasn’t.
Certain blind spots only became visible when I could see all my transactions in one place, filtered and sorted and grouped in ways my bank’s interface, where I see a single account’s transactions at a time, doesn’t support.
One example is that I felt like our household was spending a huge portion of our income on digital subscriptions. Stuff like Netflix, Dropbox, Youtube Premium, and the like. Although we do spend a lot on these subscriptions, it’s only a fraction of what we spend on other categories. In the scheme of things it has made me feel less bad about this type of spending, and has oriented towards me thinking about other types of spending.
Another example is seeing just how much our household spends on insurance. I believe we are appropriately insured, and in a lot of ways I feel a lot of gratitude and privilege for being able to spend as much money as we do on managing risks. It gives my wife and I a lot of peace of mind. But it has made me even more conscious about being thoughtful regarding how we insure.
The interesting thing is: I had access to all this information before. Every transaction was already there. Periodically, I would manually “audit” my expenditure and categorise my transactions in Excel. (It was a pain, which is why I didn’t do it more regularly!) But it was invisible in the way that individual trees become invisible in a forest.
The tool doesn’t give you new information – it makes the information you already have visible in a way that creates insight.
![]() A screenshot from an earlier beta version of Snoopy. This isn’t my own spending! It’s dummy data.
A screenshot from an earlier beta version of Snoopy. This isn’t my own spending! It’s dummy data.
The future you can’t quite imagine
Then there’s the future. You know intellectually that compound growth matters. You know that small differences in investment returns make a big difference over decades. You know that retiring five years earlier means you need more money to live on and will have fewer years of compound growth working in your favour.
But knowing it intellectually and SEEING it are very different things.
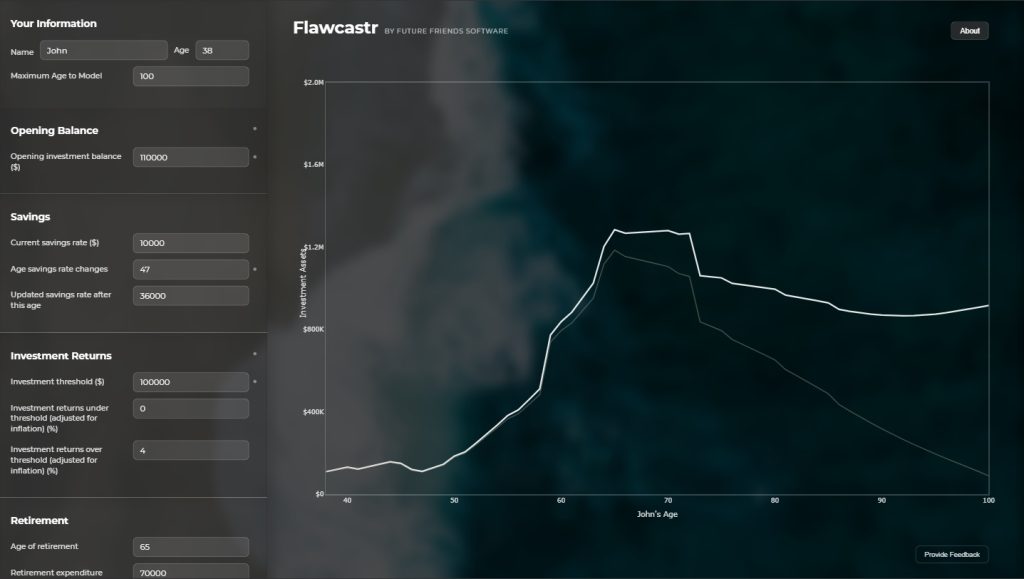
For years, while I was running Fairhaven Wealth, I helped my financial planning clients “flawcast” their financial future. We’d make a variety of assumptions, in relation to savings levels, spending, investment returns, retirement age, NZ super eligibility, one-off and periodic incomings and outgoings, etc. They’d see the future of their financial lives in a visual way. And we could adjust assumptions and see the impact.
What I’ve observed, both in myself and when working with clients, is that seeing a chart with a line that changes as you change your assumptions, can hit hard. Something shifts in real time when people see their trajectory visualised.
Someone might say “I want to retire at 60” and think they’ve made a decision. But then they see what that actually means - the line on the chart, how much they need to save, what happens to their trajectory - and suddenly the decision becomes real in a way it wasn’t before. Sometimes they realise they can’t actually retire at 60 without significant changes. Sometimes they realise they can retire earlier than they thought. Sometimes they see that working three more years makes a bigger difference than they imagined.
It’s not that the information was unavailable before. They could have done the calculations. But seeing it externalised creates a different kind of knowing. The abstract becomes concrete. The intellectual becomes visceral.
For me personally, it took dozens of iterations – maybe 20 or 30 runs over several years – before my gut fully caught up with what the numbers were showing. The numbers kept saying “you’re going to be fine” and my gut kept saying “but what if…”.
Eventually, the repetition of seeing the same pattern – even with pessimistic assumptions, even with various setbacks modelled in – made me believe it in a way that changed my quality of life NOW. Not in the future when I’m actually retired, but today. I worry less. I make different decisions about time versus money trade-offs. I’m more willing to take a sabbatical or turn down work that doesn’t interest me.
There are people much wealthier than I am who live with more financial anxiety. The difference isn’t the money. It’s that they haven’t internalised what their money means for their future. The knowledge stays abstract, and abstract knowledge doesn’t calm the lizard brain.
Two types of invisibility
These experiences have clarified something for me. There are two distinct types of invisibility, and often they work together:
Revelation
You don’t even know something until you see it externalised. Like discovering your actual spending patterns, or seeing how dramatically early retirement affects your trajectory, or realising your baseline mood is more positive than you thought. The information existed, but it was scattered or abstract in a way that made it functionally invisible. This is the blind spot you couldn’t find even when looking for it.
Reification
You know something intellectually, but seeing it repeatedly makes you BELIEVE it. Like running financial projections 20 times and eventually internalising that you’re going to be financially okay. Or tracking your mood daily until you develop a felt sense of resilience you didn’t have before.
Both types matter. The first gives you new knowledge. The second transforms existing knowledge from something you know to something you feel. And often, as with the mood tracking, you get both at once.
Why externalisation can work
I think there’s something powerful about externalisation – taking what’s in your head (or scattered across bank accounts and spreadsheets and vague memories) and putting it out there where you can see it.
When it’s external, you can see it differently. You can zoom in and zoom out. You can compare patterns across time. You can see yourself from the outside, which breaks the narrative you’re telling yourself from the inside.
Tools that externalise your transaction history or project your financial future take information that’s theoretically available to you and make it visible in a way that creates actual insight.
One of the key things I’ve learned? You often don’t know in advance what will create insight.
I’ve tried tracking systems that went nowhere. Metrics that seemed important but revealed nothing. Visualisations that looked good but didn’t change how I thought about anything.
There’s a speculative quality to it. You have to try different ways of seeing before you discover which one makes the invisible visible for you. Sometimes you need to see the right thing at the right time in the right way.
Data as evidence against your narrative
The mood tracking was particularly powerful because it both revealed something I didn’t know (my baseline is positive) and created a felt sense I didn’t have before (resilience). The data contradicted my self-perception and, through repetition, built something new and positive.
The financial projections worked because the repetition eventually overwhelmed my anxiety. One projection didn’t do it. Twenty projections, all showing the same thing, eventually did.
The health data worked because it gave me nuance I didn’t have - showing not just that a difficult period was difficult, but how it manifested physically and what had immediate impact versus what didn’t.
The spending analysis worked because it revealed blind spots I couldn’t find just by thinking harder. Patterns that only became visible when externalised.
In each case there were different mechanisms, but the same underlying principle was at play: externalising made something visible that had been invisible, and seeing it changed how I thought and felt and acted.
What I’ve built
These insights have shaped two tools I’ve been working on: Snoopy and Flawcastr.
Snoopy is for seeing where your money actually goes. You import your bank transactions and categorise them. The tool learns from your patterns. What emerges isn’t just “I spend money on coffee” but the actual patterns over time - how spending has changed, how different categories compare, where the blind spots are.
It’s built with privacy as the foundation - everything runs on your computer, your financial data never leaves your machine. One-time purchase, not a subscription. The goal is to make patterns visible that are invisible when you’re just living through your transactions day by day.
Flawcastr is the tool version of what I used to do manually with clients - seeing your financial future with enough clarity that you can explore different scenarios and understand the implications of your choices. Retire five years earlier? Here’s what that means. Save an extra $5,000 per year? Here’s the trajectory. Get 2% higher returns? Here’s the difference over 30 years.
There’s a free browser-based version available now. Info is here, and Flawcastr itself is here. A more sophisticated desktop version will come later. The aim is the same: making the invisible visible so your gut can catch up with your head.
These aren’t products I built to solve someone else’s problem. They’re approaches I’ve found valuable, now available as tools for others.
My invitation
I don’t know what’s invisible to you. Neither do you, probably! That’s the nature of invisibility.
But I’d wager there are things you “know” intellectually that you don’t really believe. And things you think you know that are actually wrong. And things you don’t even know you don’t know.
Maybe you think you know where your money goes, but seeing two years of transactions categorised and visualised would reveal patterns you haven’t noticed.
Maybe you intellectually understand that you’ll be financially comfortable in retirement, but seeing it projected repeatedly would calm the anxiety you carry today.
Maybe you think early retirement is only slightly more expensive than retiring at 65, but seeing the trajectories side by side would make you realise how dramatic the difference actually is.
Or maybe - and this is entirely possible - you’ll look at your data and discover you’re exactly right about everything. That would be valuable too. Certainty is worth something.
The only way to find out is to look.
The difference between knowing and KNOWING might be the difference between chronic financial anxiety and genuine peace of mind. Between thinking you understand your spending and actually seeing where your money goes. Between intellectually knowing you’ll be OK and feeling it in your gut.
It’s a difference that makes a difference.